


In my last post, I talked about how you can look at a specific screen or query and analyze it using the SQL index tuning wizard. But what happens if you don’t know which screen or query are causing issues? Well there are two additional ways you can monitor the system at a higher level to gain insight into the activity occurring against the SQL database.
SalesLogix Profiler
The first option is to use the SalesLogix profiler. This is a standard component of all 7x client installations. There is no menu shortcut for the application but if you browse to your SalesLogix directory (C:Program FilesSalesLogix by default) you will find a file called SLXProfiler.EXE.
Double click the icon to start the SalesLogix profiler. This utility will allow you to monitor any programs that connect using the SalesLogix OLE DB provider, such as the SLX client, Architect, Admin, etc.
When the application starts you will see a blank screen with only one icon enabled on the toolbar.

Click this button.
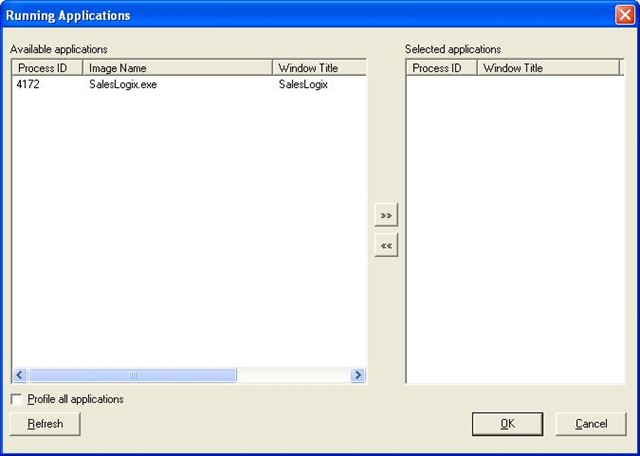
You will see all running applications utilizing the Provider.
Select the application(s) you wish to monitor and move it to the right side of the screen. Click OK. You will now be returned to the previous screen, which will now have several tabs and enabled toolbars. As your monitored application is used you will see real-time the actions that are performed. On the SQL Log tab, you will see the various SQL statements being performed, both the client side Query, and the Actual query as it is passed through the provider with security functionality appended.
One of the important columns to look at is the Duration(ms). This is the time it took to perform the query. If you see a duration that is very high, that is a good candidate for analysis to see if something can be done to speed up the query. Click on the line. In the lower portion of the screen, you will see both the client side and executed SQL. Use the Executed SQL statement, as this is the statement actually run on the server.
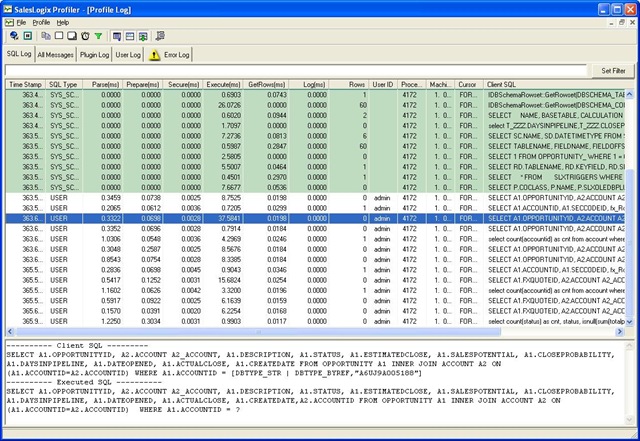
Now with that query, you can repeat the same process as in my previous post to analyze the query in SQL Query Analyzer to see if additional indexes can be added.
Note: that this monitoring is only based off the local client running on the same computer as the SLXProfiler.
SQL Profiler
So both approaches so far require that you work pretty hard to find poorly running areas of the system. Isn’t there something that can monitor and analyze a database’s activity a little bit quicker? Of course! The last are I want to touch on is using the results of SQL Profiler.
SQL Profiler is a SQL utility that can be launched from the SQL Enterprise Manager (Tools…SQL Profiler) or from the Start menu (Start…Program…Microsoft SQL Server…Profiler) You will need to log in to Profiler as sa or an equivalent SQL user.
When you open Profiler you will need to start a new Trace (File…New…Trace). At this point you will be prompter to connect to a SQL server using the standard SQL login.
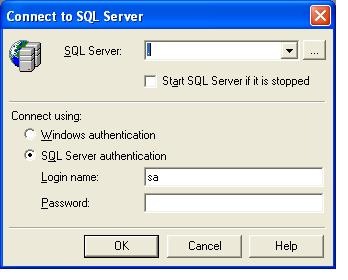
Once logged in you will need to define your Trace parameters. SQL Profiler analyzes the entire SQL server, so it is a good idea for servers hosting more than one active database to filter down the trace to just the relevant database you want.

For the purpose of monitoring SQL performance we can leave all of the defaults except for adding a filter to only monitor the SalesLogix database. To do this click on the Filters tab.
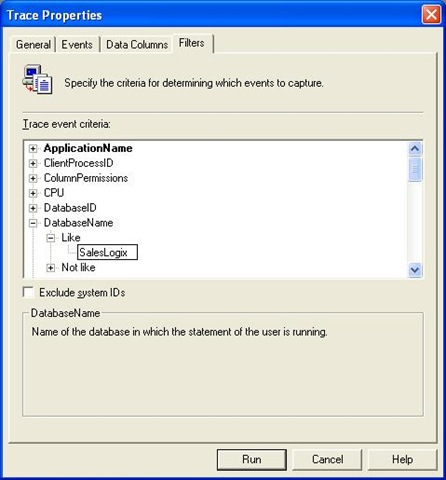
Under the DatabaseName node, expand the Like filter and type in the Name of the SalesLogix database on the SQL server.
When you click Run, SQL Monitor will now track all of the activity occurring on the SQL server. You can let this Trace run while users perform their normal tasks in SalesLogix. When you feel that you have recorded a representative amount of activity on the server, save the file as a Trace File by going to File…Save As…Trace File. A save dialog will appear where you can save the SQL Trace file (.TRC).
Now with that trace file we can utilize the SQL Tuning Wizard to analyze the activity and develop recommended indexes.
Open up the SQL Index Tuning Wizard via the Query Analyzer, just as I discussed in my last blog post. When you get to the following screen choose My Workload File instead of the SQL Query Analyzer selection, as we have done previously.

Browse to the .TRC file you saved earlier. Now when you complete the remaining steps of the wizard, it will analyze all of the activity in the Trace log and recommend index changes based on its analysis.
Note: Depending on the amount of activity saved in the Trace file the analysis can be lengthy and resource intensive. It is recommended this be done after hours.
Again, I strongly recommend that whenever doing these kind of database level changes you first test the changes in a test environment and only after doing so, attempt to do the same in a production environment!


So well written even i could do this. Great job.